
The Best Excel Shortcuts for Financial Modeling
The best Excel shortcuts for financial modeling aren't a generic alphabetized list — they're the small set of keystrokes senior analysts run thousands of times per deal. Every senior associate you respect has the same quiet habit: their hands almost never leave the keyboard. This guide is the shortcut stack behind that habit — organized by real modeling workflow, not by Excel menu order. It's written for investment banking analysts, private equity associates, FP&A teams, and finance students who need to build, audit, and present models under deal pressure. Download the Financial Modeling Excel Shortcut Cheat Sheet (PDF) →
See also: Financial Modeling Excel Speed Test
Why elite analysts barely touch the mouse
Watch a senior PE associate model for ten minutes. You'll notice their right hand never leaves the home row, and their left hand is constantly on Alt, Ctrl, and Shift. It's not a flex — it's how the work actually gets done at 1am, and it's the fastest path to stop using the mouse in Excel entirely.
Speed compounds. A single shortcut saves maybe a second. But a live LBO model has thousands of micro-actions: locking refs, copying formulas, reformatting outputs, jumping to precedents, inserting rows for new debt tranches. Multiply one second by a few thousand and you’ve bought yourself an hour of sleep.
Focus stays intact. Every time your hand moves to the mouse, your eyes leave the formula bar, your working memory dumps, and you have to re-load the context of what you were building. Keyboard-first modeling keeps the mental model on screen at all times.
Errors drop. Mouse-clicking your way through a paste-special dialog is where formulas get overwritten, hardcodes sneak into formula cells, and cross-sheet links get scrambled. The keyboard path is deterministic — your fingers hit the same sequence every time.
Fatigue drops too. By hour 14 of a model build, the small physical cost of reaching for the mouse on every action becomes a real source of mistakes. Keyboard discipline is partly an ergonomics decision.
A real example: building a deck-ready sensitivity table
Sensitivity tables are the most consumed part of any model — they're what shows up in the IC deck. Build them with the same discipline as the rest of the model.
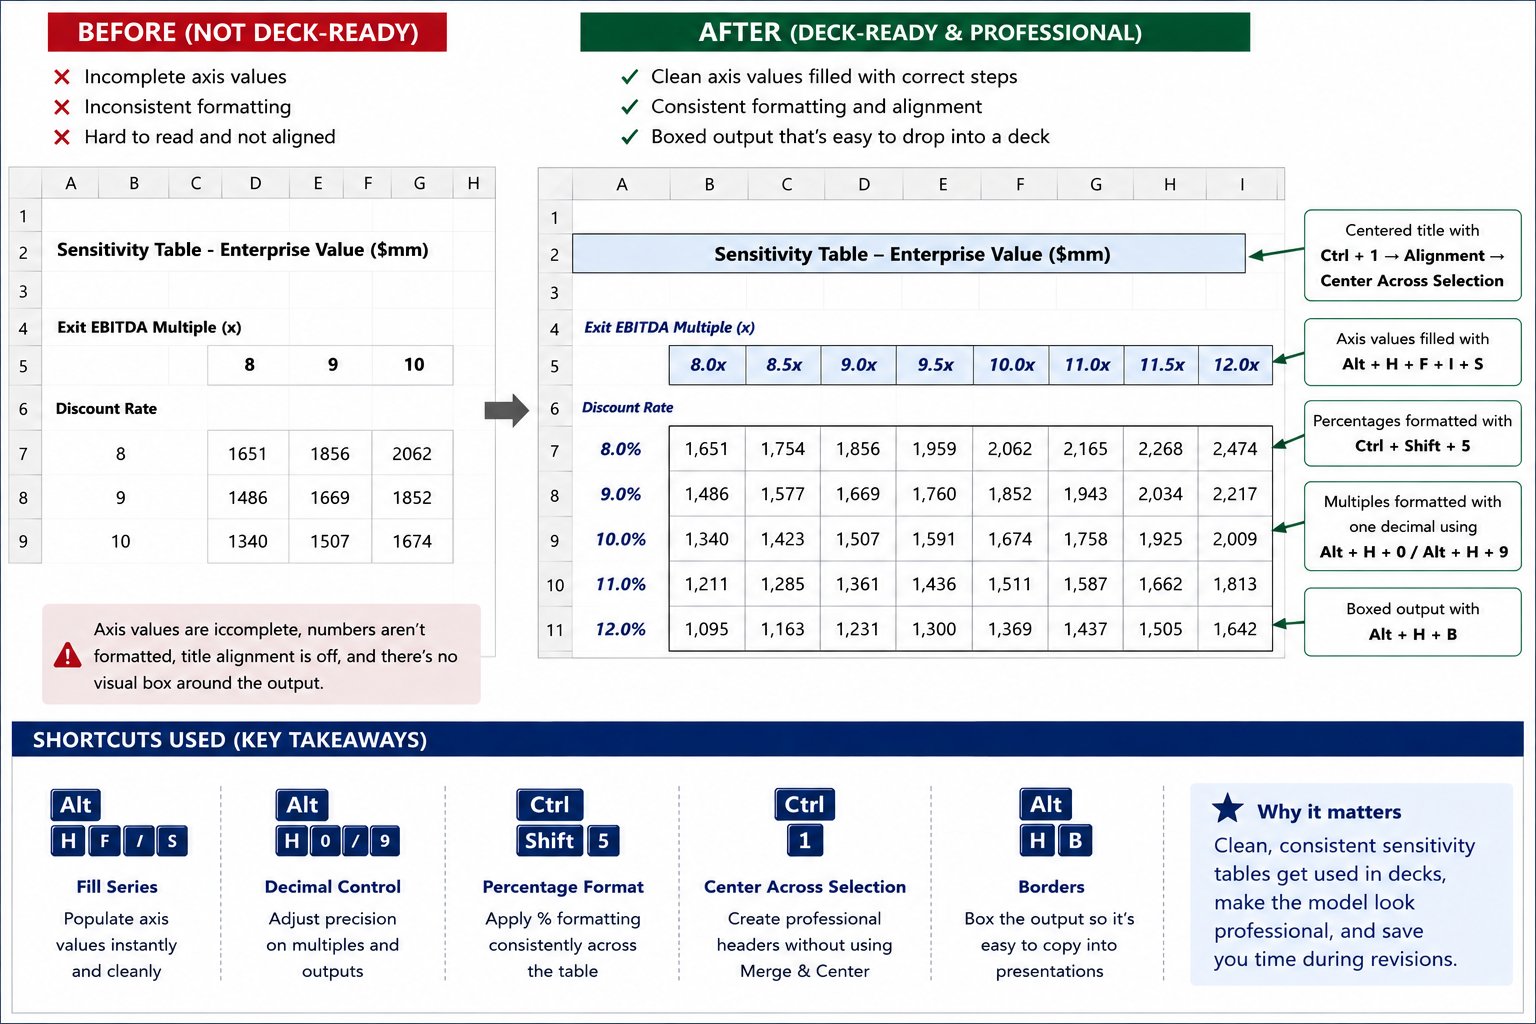
These are small choices, but they're the difference between an output the MD forwards straight to the client and one that gets sent back for cleanup. The same formatting discipline applies across every output block in the model — assumptions, comps, returns, IC summary.
Navigation and worksheet control
A real financial model is rarely one tab. A 3-statement model has Assumptions, Revenue Build, OpEx, Debt Schedule, Working Capital, IS, BS, CF, and Outputs. An LBO adds Sources & Uses, Returns, and Sensitivity. You spend a huge fraction of your time just moving between these. (Microsoft maintains the full cross-platform list in its official Excel keyboard shortcuts reference; the table below is the finance-specific subset that actually matters in a model.)
| Shortcut | What it does | When you use it in a model |
|---|---|---|
| Ctrl + PgUp / PgDn | Move between worksheet tabs | Flip Assumptions → Revenue → Debt → IS → BS → CF without touching the tab strip |
| Alt + H + O + R | Rename worksheet tab | Rename a fresh tab to ‘Debt Schedule’ while scaffolding an LBO |
| Alt + H + I + S | Insert worksheet | Drop a new ‘Sensitivity’ tab without leaving the keyboard |
| Alt + H + D + S | Delete worksheet | Strip out a stale scratchpad tab before sending the model to the VP |
| Ctrl + Alt + + / Ctrl + Alt + - | Zoom in / zoom out | Pull back to see an entire 3-statement model, then zoom in on a single calc |
| Alt + W + F + F | Freeze panes | Lock period headers and account labels on every schedule |
Workflow tip. When scaffolding a new model, build the tab structure first using Alt + H + I + S to insert and Alt + H + O + R to rename. Set freeze panes on every schedule (Alt + W + F + F) at the same row and column so navigation feels consistent across tabs.
Zoom discipline. Use Ctrl + Alt + + and Ctrl + Alt + - when you need to zoom in on a single calc block during audit, then zoom back out to review the schedule’s shape. Don’t leave a model at 130% zoom for the next analyst.
Selection and structure: building the bones
Structural shortcuts are the ones you use while the model is still under construction — adding line items, grouping supporting schedules, indenting drivers under their parents.
| Shortcut | What it does | When you use it in a model |
|---|---|---|
| Shift + Space | Select entire row | Highlight a line item before formatting it as a subtotal |
| Ctrl + Space | Select entire column | Apply a number format across an entire forecast year |
| Ctrl + Shift + + | Insert rows or columns | Add a new debt tranche to the cap structure |
| Ctrl + - | Delete rows or columns | Remove a deprecated assumption row from the build |
| Alt + Shift + → | Group rows or columns | Collapse the revenue build behind a clean output line |
| Alt + H + 5 / 6 | Decrease / increase indent | Indent supporting line items under their parent driver |
Debt schedule example. Adding a new tranche to a cap structure is Shift + Space → Ctrl + Shift + +: row selected, row inserted, no mouse. Then Ctrl + R to pull the prior tranche’s mechanics across the forecast columns.
Grouping schedules. Once a revenue build is finalized, select the supporting rows and hit Alt + Shift + → to group them under a single clean output line. This is what makes a 400-row model look like a 50-row model when a VP opens it.
Indent for hierarchy. Alt + H + 6 indents, Alt + H + 5 outdents. Use indents to visually nest sub-drivers under their parent (e.g., volume and price under revenue).
Formula building and auditing
Formula shortcuts are where the seconds really add up. Locking references with F4 in a WACC calc, dropping Alt + = on a sources & uses, walking precedents with Ctrl + [ across an LBO returns schedule — this is the actual moment-to-moment work of modeling.
| Shortcut | What it does | When you use it in a model |
|---|---|---|
| Alt + = | AutoSum the selected range | Drop a SUM at the bottom of an opex schedule or sources & uses |
| F4 | Cycle reference modes ($A$1 → A$1 → $A1 → A1) | Lock the tax rate or interest assumption in an LBO interest calc |
| Ctrl + R / Ctrl + D | Fill right / fill down | Extend a forecast formula across a new year after building it once |
| Ctrl + ` | Toggle formula view on the sheet | Screenshot a calc block into a model appendix or training deck |
| Ctrl + [ | Jump to the precedent cells | Walk an EBITDA output back to a unit-economics driver across tabs |
F4 in practice. In an LBO interest calculation, the interest rate lives on the Assumptions tab and the debt balance lives on the Debt Schedule. You want the rate locked ($D$4) and the balance to roll forward by period. Build the formula once, hit F4 on the rate reference, then Ctrl + R across the forecast.
Auditing with Ctrl + [. When something looks off downstream, hit Ctrl + [ on the broken cell to jump to its precedents — even on another tab. F5 + Enter jumps back. This is the fastest way to trace a chain from “EBITDA looks wrong” back to “someone hardcoded a number into the volume driver.”
Show formulas mode. Ctrl + ` flips the entire sheet into formula view. Use it during peer review to scan an entire schedule for consistency in a single glance — every cell in a row should have the same formula shape.
Formatting and presentation: model credibility
Formatting is not cosmetic. In banking and PE, a poorly formatted model gets dismissed before its math is checked. Number formats, color discipline, and section headers are how an MD decides whether to trust the rest of your work.
| Shortcut | What it does | When you use it in a model |
|---|---|---|
| Ctrl + Shift + 4 | Currency format | Reserved for the first row of a section and totals row |
| Ctrl + Shift + 5 | Percentage format | Margins, growth rates, IRRs, leverage ratios |
| Ctrl + Shift + 3 | Date format | Period headers on a quarterly debt schedule |
| Alt + H + F + C | Open font color menu | Blue for hardcodes, black for formulas, green for cross-sheet links |
| Alt + H + H | Open fill color menu | Light yellow flags inputs still awaiting VP review |
| Alt + H + B | Apply borders | Finish a comps table or assumptions block before printing |
| Alt + H + 0 / 9 | Increase / decrease decimal places | Show two decimals on multiples, zero on dollar line items |
| Ctrl + Alt + V → T | Paste formatting only | Copy a header row’s styling to a new section without overwriting formulas |
| Alt + H + O + I / A | AutoFit column width / row height | Clean up after pasting a long account name into the model |
| Ctrl + 1 → Alignment → Center Across Selection | Visually center a label across columns without merging cells | Replace Merge & Center on section headers so Ctrl+Arrow navigation stays intact |
The color convention. Use Alt + H + F + C to set blue for hardcoded inputs, black for in-sheet formulas, and green for cross-sheet links. This is the standard across every major bank — and the moment a VP sees a blue formula or a black hardcode, they assume the rest of the model is sloppy.
Center Across Selection beats Merge & Center. Merging cells breaks Ctrl + Arrow navigation, breaks formula references, and breaks paste operations. The bank-standard alternative is Ctrl + 1 → Alignment → Horizontal → Center Across Selection. Same visual centered header, no merged cells, model stays auditable.
Decimal discipline. Alt + H + 0 adds a decimal, Alt + H + 9 removes one. Multiples and ratios get one or two decimals; dollar amounts in a model get zero. Consistency here is what separates a model that looks like a draft from one that looks like a final.
Paste formatting only. Ctrl + Alt + V → T pastes only the formatting from the copied cell — fonts, colors, borders, number formats — without touching the underlying formula. Use it when you’re styling a new section to match an existing one without overwriting the math.
AutoFit. Alt + H + O + I autofits column width, Alt + H + O + A autofits row height. Run them after pasting in long account names so the model doesn’t look like a draft.
Data and analysis: filters, pivots, and series
Modeling work isn’t only formulas. Diligence on a target involves cutting through hundreds of rows of transaction comps, portfolio data, or customer cohorts. The data shortcuts below are the ones you reach for in those moments.
| Shortcut | What it does | When you use it in a model |
|---|---|---|
| Ctrl + Shift + L | Toggle filters | Cut a portfolio company list down to one sector during diligence |
| Alt + ↓ | Open filter dropdown | Open the filter on the active column header without grabbing the mouse |
| Alt + ↓ → C | Clear selected filter | Reset a single column’s filter while keeping the others active |
| Alt + A + C | Clear all filters | Snap the dataset back to full view before pivoting |
| Alt + N + V | Create Pivot Table | Spin up a quick pivot on transaction comps without menu hunting |
| Alt + H + F + I + S | Fill series | Generate forecast period headers (Year 1, Year 2, …) in one motion |
Filters without the mouse. Ctrl + Shift + L toggles filters on the active range. From there, Alt + ↓ opens the dropdown on the active header — no clicking the tiny arrow. To clear filters, Alt + ↓ → C clears the active column; Alt + A + C clears them all.
Pivot tables for diligence. Alt + N + V opens the PivotTable dialog directly. Useful when you’re slicing a customer file by segment during commercial diligence, or rolling up transaction comps by sector before pulling multiples.
Fill series for period headers. Alt + H + F + I + S opens the Fill → Series dialog. Type “Year 1” in the first cell, select across, run the shortcut, and you have a clean period header row in one motion.
Auditing a large model: a keyboard-first workflow
Auditing inherited models is half the job. Whether you’re second-checking a colleague’s LBO before a Monday IC or pressure-testing a target’s management model during diligence, the keyboard-first audit loop looks like this:
- Flip through every tab with Ctrl + PgDn and check that freeze panes are set consistently.
- Toggle Ctrl + ` to scan each schedule in formula view — look for the row where the formula pattern breaks (a hardcode hiding among formulas, or a manual override).
- Land on a suspect output cell, hit Ctrl + [ to walk to its precedents — across tabs if needed — until you find the source.
- When you find a hardcode that should be a link, fix it and use Alt + H + F + C to color it back to formula black (or green for cross-sheet).
- After every meaningful change, hit Ctrl + S and move on. Don’t batch fixes — small, atomic edits are easier to unwind if you break something downstream.
Run this loop with the mouse and it takes an afternoon. Run it with shortcuts and you’re done before lunch.
How to actually learn this stack
Reading a shortcut list does almost nothing. The list above is useful as reference, but no analyst became fast by re-reading shortcuts on a PDF. They got fast by using them in real workflows, every day, until their fingers stopped checking with their brain first.
Mastery comes from three things, in order:
- Repetition — the same five or six shortcuts, used hundreds of times per week.
- Workflow context — drilling shortcuts inside a real modeling task, not as isolated keystrokes.
- Muscle memory — the point where you’ve stopped thinking about the shortcut and it just happens.
Most analysts who became genuinely fast did it in one or two specific ways: physically taping over their mouse for a week, or using a shortcut training tool that forces the keystroke before letting them advance.
Xcel Hotkeys is built specifically for the second path — a finance-specific shortcut trainer with drills modeled on real IB and PE workflows. Every drill blocks mouse use, validates the actual shortcut you press, and tracks your speed over time. If you want a baseline first, the Financial Modeling Speed Test takes about five minutes and gives you a clear gap analysis against where a strong analyst should be.
The shortcut stack, in one place
For deeper dives on adjacent topics, see the formatting shortcut guide, the broader 25 shortcuts for investment banking analysts article, or the workflow-focused how to stop using the mouse in Excel guide. The full library lives in the Excel resources hub.
Frequently Asked Questions
Related Training
Ready to Get Faster?
Start practicing with hands-on Excel drills designed for financial professionals.